

Note
Go to the end to download the full example code.
CFD: a sweep with a turbulence model#
Design an aerofoil CFD campaign where compare() restricts itself to nominal-capable criteria.
A CFD study sweeps an aerofoil across four control factors: angle of attack, inlet velocity, a geometry ratio, and the turbulence model (a nominal switch). Each CFD run is expensive, so a tight space-filling design matters, and comparing criteria before committing pays off. The flow observables (lift, drag, separation point) are computed downstream by the CFD solver, not by Mergen.
Because the space contains a nominal factor (the turbulence model),
compare() automatically restricts itself to the criteria that support
nominal factors, so the comparison stays valid.
Parameters#
angle_of_attack (0-15 deg, 1-degree steps): the pre-stall range, swept in whole degrees.
velocity (10.0-60.0 m/s, continuous, rounded to 1 decimal): the inlet speed range of interest.
geometry_ratio (0.10-0.30, continuous, rounded to 2 decimals): a normalised thickness/chord-style ratio.
turbulence_model (nominal: ‘k-epsilon’, ‘k-omega’, ‘sst’): three standard closures with no intrinsic ordering.
What to look at#
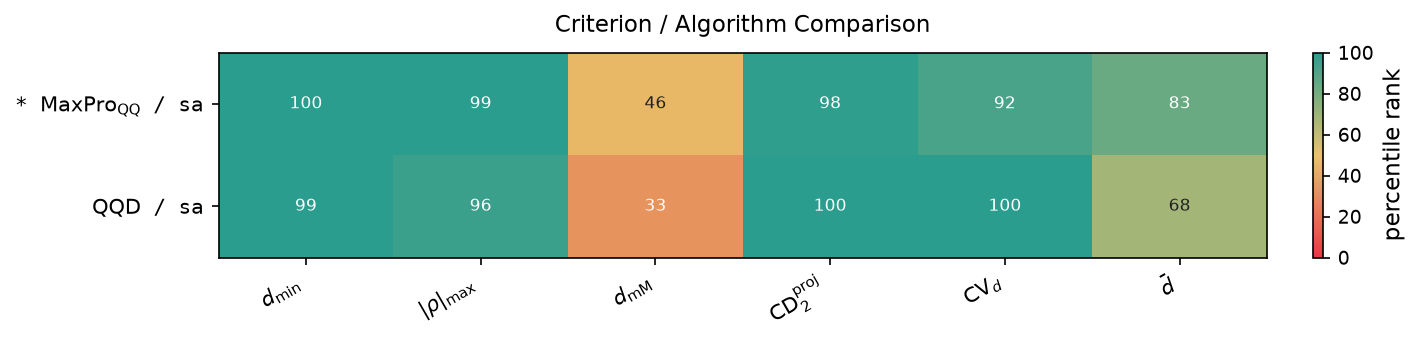
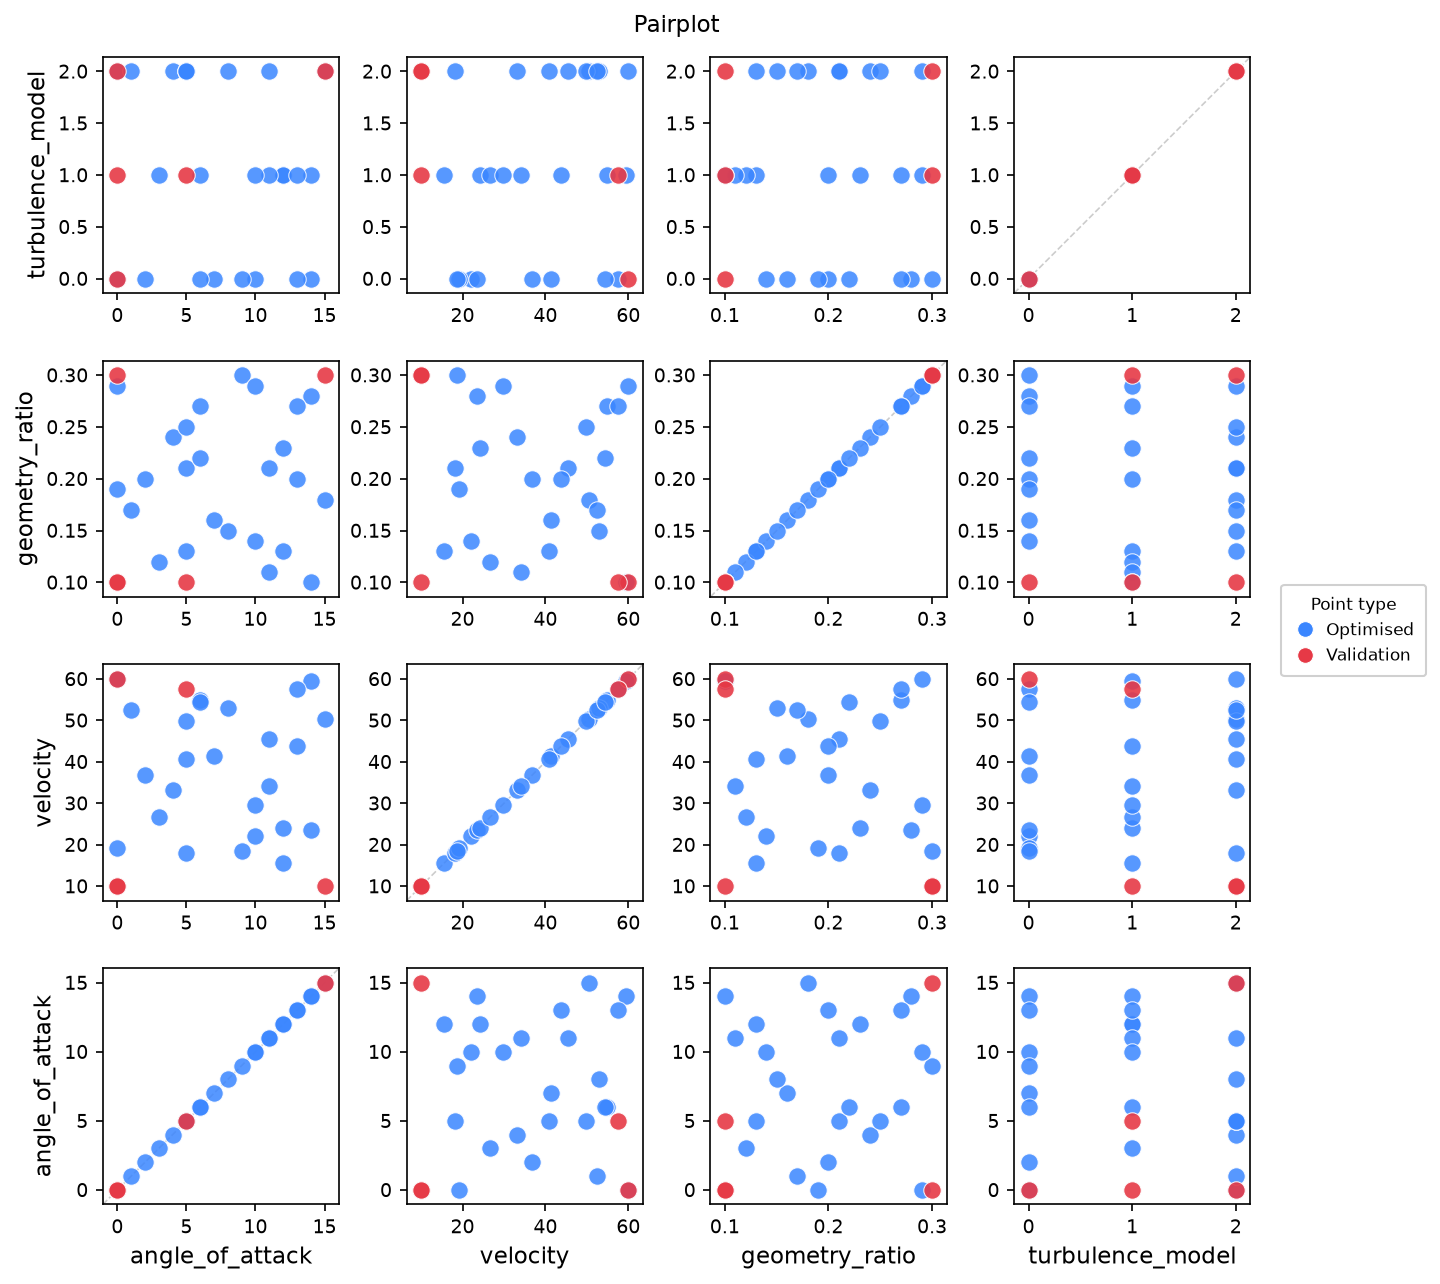
comparison.plot()(saved ascomparison_matrix_1.png): the percentile-rank heat map of the sweep, restricted to the criteria that support the nominal turbulence factor; the winning row is starred.comparison_table.md(saved): the criteria compatible with this mixed space, ranked by percentile against a shared Monte Carlo baseline; the winning row is flagged.best_result.quality_report()(printed): the winning design’s quality.The saved pairplot: even coverage across the numeric factors, with all three turbulence-model levels visited.
cfd_runs.csv: the run list handed to the CFD solver.
Mergen features used#
A nominal factor in a mostly numeric space.
Sampler.compare(): on a mixed space, criteria=None auto-selects the nominal-supporting criteria, so the comparison is valid. Each combination is optimised n_repeats times (default 5) from reproducible seeds and ranked on the mean metric percentile via a Pareto/Utopia rule.ComparisonResult.best_result and its saved table.
Estimated runtime: a few minutes on one core. On a multi-core machine
pass n_jobs=-1 to compare() to run the repeats in parallel (same
result, faster); leave it at the default to stay single-core.
from mergen import ParameterSpace, Sampler

# 1. Define the mixed CFD control space.
space = ParameterSpace({
    'angle_of_attack':  range(0, 16, 1),                             # degrees
    'velocity':         ('continuous', 10.0, 60.0, {'round': 1}),    # m/s
    'geometry_ratio':   ('continuous', 0.10, 0.30, {'round': 2}),
    'turbulence_model': ('nominal', ['k-epsilon', 'k-omega', 'sst']),
})

# 2. Compare the criteria compatible with this mixed space. The
#    optimiser is tuned down so the sweep is quick for a demonstration.
sampler = Sampler(space)
sampler.set_design(n_samples=25)
sampler.set_optimizer('sa', n_restarts=2, max_iter=400)
comparison = sampler.compare(
    n_jobs=1,  # one core; set n_jobs=-1 to use all cores (same result)
)

# 3. Save the ranking table.
comparison.to_markdown('comparison_table.md')
comparison.plot(save=True)

# 4. Inspect and save the winning design.
best = comparison.best_result
best.quality_report()
best.plot('pairplot', save=True)
best.to_csv('cfd_runs.csv')
/opt/hostedtoolcache/Python/3.12.13/x64/lib/python3.12/site-packages/mergen/space.py:384: UserWarning:
[MERGEN WARNING]  Parameter 'geometry_ratio': rounding to 2 decimal place(s) reduced the grid from 100 to 21 distinct node(s).
  arr, kind, labels = _parse_parameter(name, spec, resolution=res)
  [COMPARE]  maxproqq + sa (5 repeats) ...
  [COMPARE]  qqd + sa (5 repeats) ...
  [COMPARE]  Monte Carlo baseline (300 random designs, n=25) ...
  [WARNING]  n_samples (25) < recommended 10*n_parameters (40, Loeppky et al. 2009). Design quality may be reduced.

════════════════════════════════════════════════════════════
  MERGEN — Space-filling Design
════════════════════════════════════════════════════════════
  Parameters      : 4
  Candidates      : 100,800
  n_samples       : 25  (prescribed_in=0, focus_in=0, optimised_slots=25)
  Total design    : 25
  Validation      : 5
  Criterion       : maxproqq
  Algorithm(s)    : sa
────────────────────────────────────────────────────────────

────────────────────────────────────────────────────────────
  MERGEN — Final Design
────────────────────────────────────────────────────────────
  Prescribed (in)  : 0
  Prescribed (out) : 0
  Focus (in)       : 0
  Focus (out)      : 0
  Optimised        : 25
  Total design     : 25
  Validation       : 5
════════════════════════════════════════════════════════════

════════════════════════════════════════════════════════════════════════
  MERGEN — Criterion / Algorithm Comparison
════════════════════════════════════════════════════════════════════════
  Priority: min_distance > max_abs_correlation   (percentile vs shared MC baseline, higher is better)
────────────────────────────────────────────────────────────────────────
best criterion algorithm  min_distance  max_abs_correlation  minimax  projection_cd2  cv_distances  mean_distance
   *  maxproqq        sa         100.0                 99.3     45.8            98.3          91.7           83.0
           qqd        sa          99.3                 95.7     32.7           100.0          99.7           68.0
────────────────────────────────────────────────────────────────────────
  Best: criteria='maxproqq', algorithm='sa'
════════════════════════════════════════════════════════════════════════
  Saved: outputs/comparison_table.md
  Saved: outputs/comparison_matrix_2.png
  [METRICS]  Computing MC baseline (300 designs)...
  [METRICS]  MC baseline complete (300 designs).

════════════════════════════════════════════════════════════════════════
  MERGEN Design Metrics  (n=25, d=4)
════════════════════════════════════════════════════════════════════════
  Metric                      Value    Baseline  Better when        Rank
────────────────────────────────────────────────────────────────────────
  Min distance               0.3219      0.1302  higher        100th pct
  Minimax distance           1.1557      1.1518  lower          46th pct
  Max |correlation|          0.0644      0.2709  lower          99th pct
  2D projection CD2          0.0826      0.1230  lower          98th pct
  CV distances               0.2823      0.3021  lower          92th pct
  Mean distance              1.0760      1.0517  higher         83th pct
────────────────────────────────────────────────────────────────────────
  Criterion scores
────────────────────────────────────────────────────────────────────────
  MAXPROQQ                   9.4015e+12  1.0048e+15  100th pct  lower
────────────────────────────────────────────────────────────────────────
  Baseline: 300 MC designs from feasible space  |  Rank = percentile among baseline designs
════════════════════════════════════════════════════════════════════════

  Saved: outputs/pairplot_14.png
  Saved: outputs/cfd_runs.csv  (30 rows)
Total running time of the script: (1 minutes 5.296 seconds)